Weekend Market Commentary 3/13/15 – $RUT, $RVX, $SPX, $VIX, $TLT, $IWM, $SPY
Big Picture:
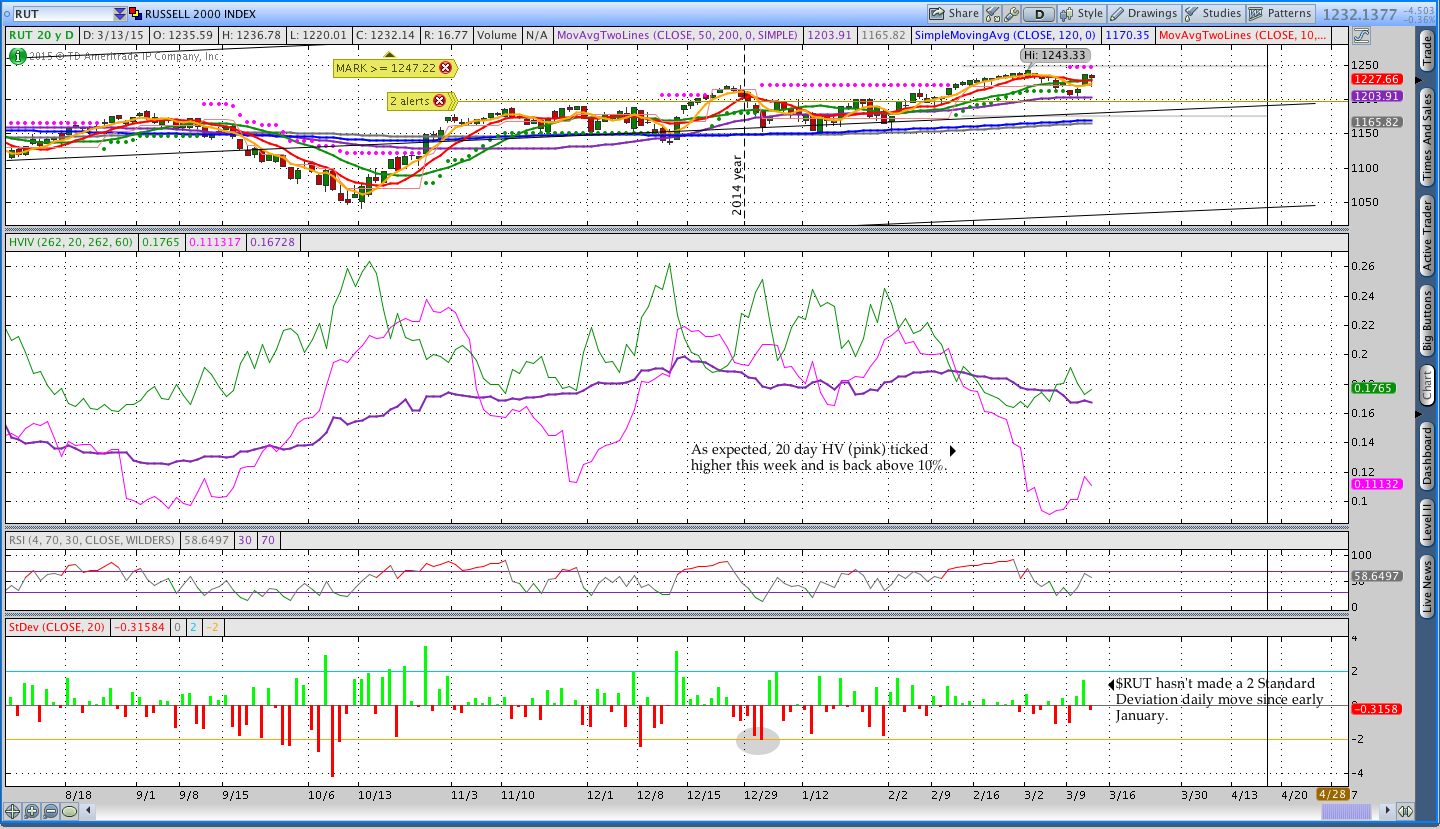
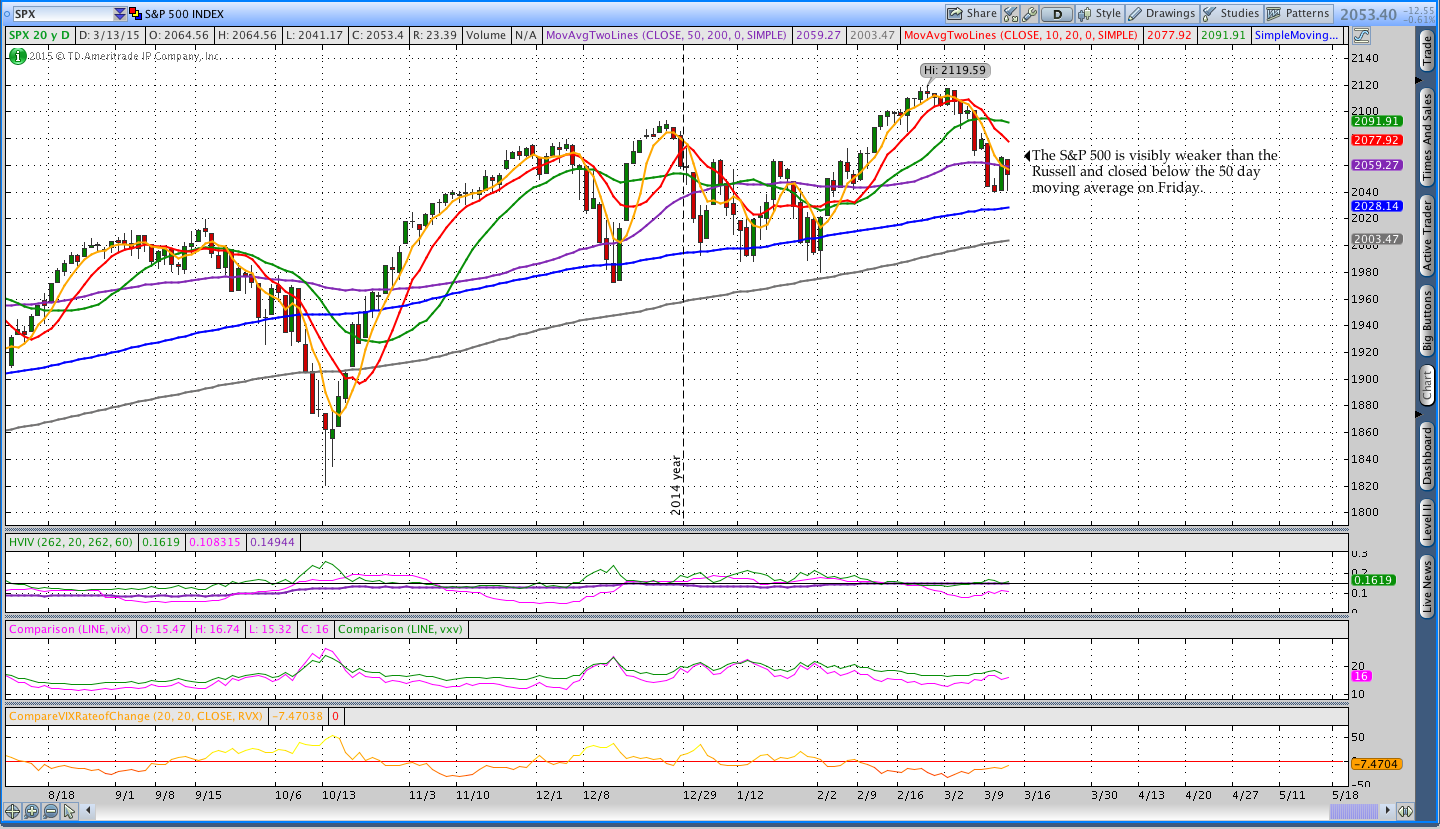
 Earlier this week I mentioned that the market was a little too quiet and that I expected an uptick in volatility. By that I meant that Historical or Realized Volatility should rise. However, that statement was not a directional call on the market. Realized Volatility is a function of returns so larger percentage returns (in either direction) should increase realized volatility. Earlier this week we saw the markets make a move lower that was followed by a big move higher. On Friday the move higher was reversed, but the Russell 2000 did find some buyers as the day went on and managed to finish the week in positive territory.
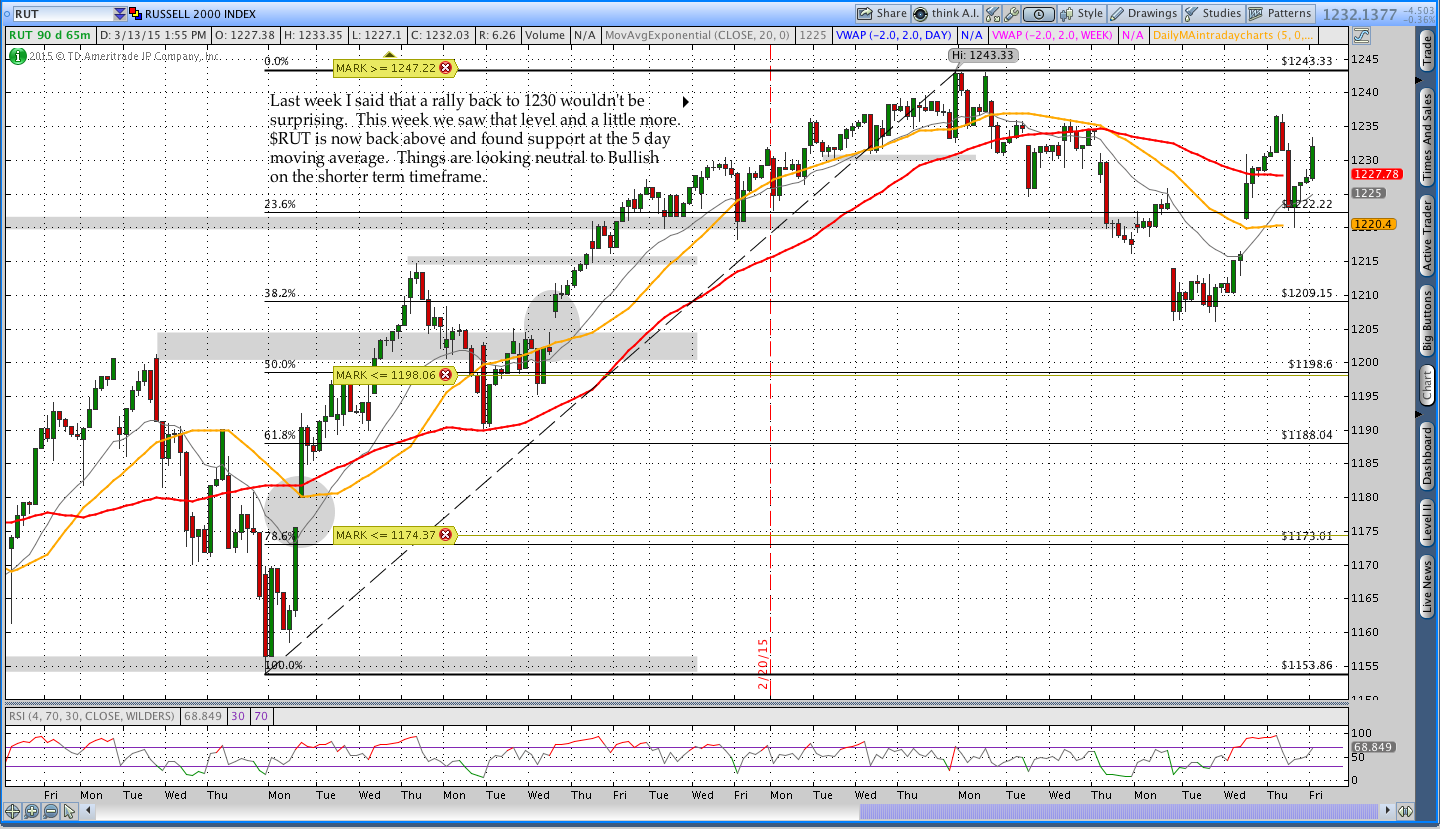
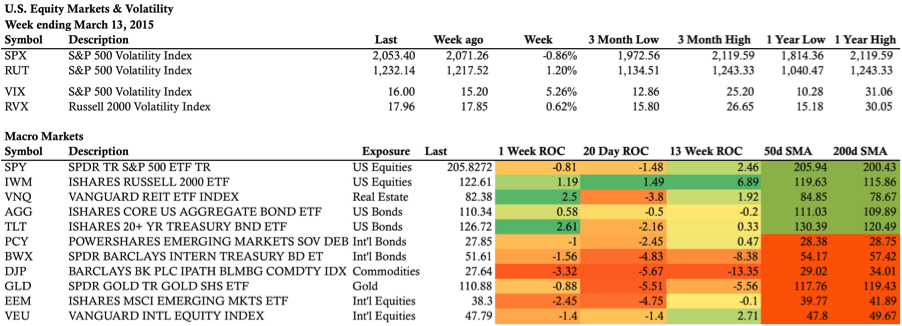
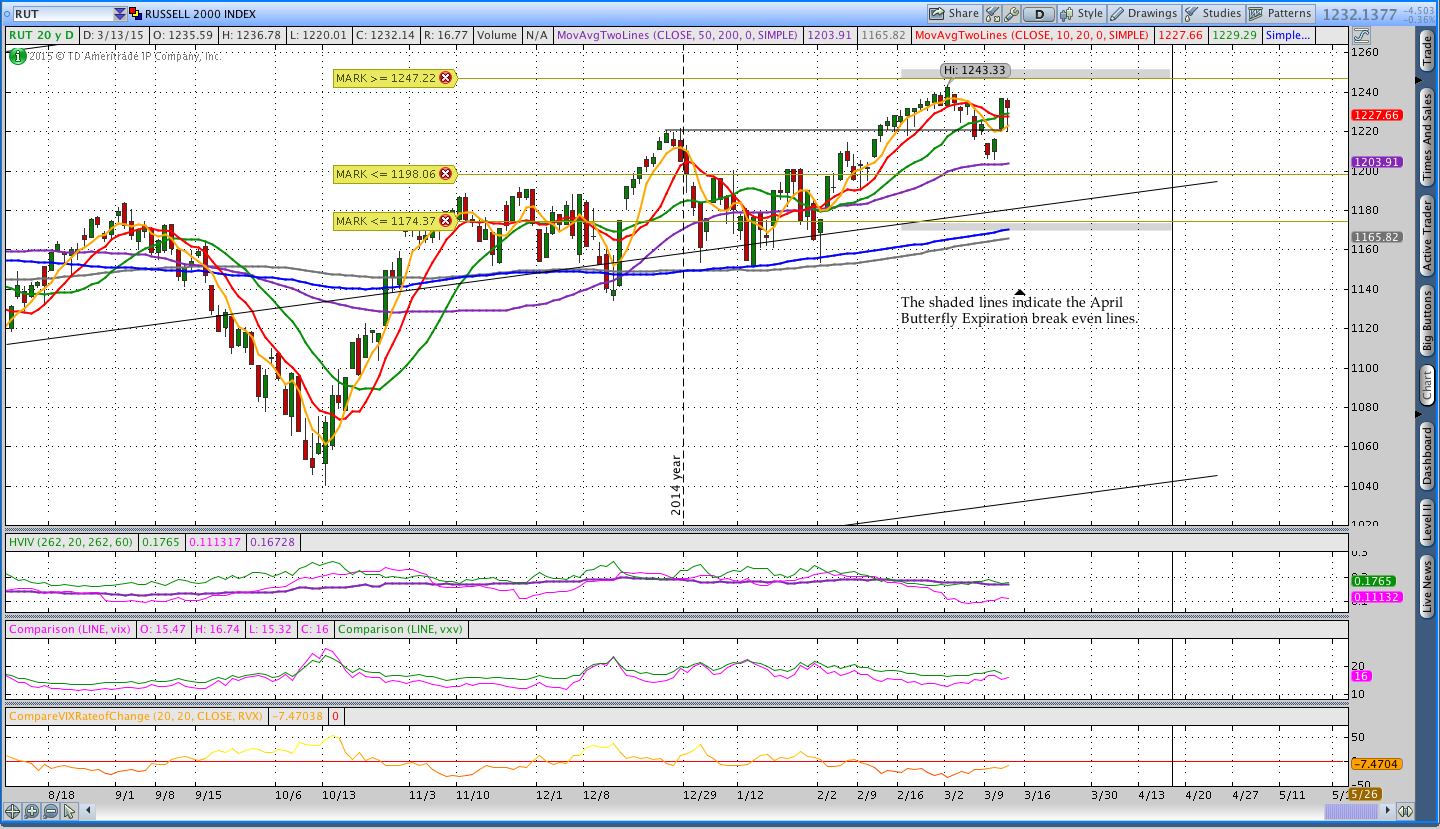
Last week the Russell closed below the 5 and 10 day moving averages, which warranted some short term caution with a longer term bullish outlook. The pullback we saw this week followed by the pop higher was definitely in line with that sentiment and the Russell is back above the 5 day moving average. The short term outlook for the Russell looks neutral to bullish. However, violating the low of this week around 1205 to 1207 would be a bearish sign for the market. Taken alone, the Russell looks good and finished the week up around 1.2%, but the S&P 500 continues to struggle and finished lower on the week. Both the VIX and RVX closed higher this week. The relative underperformance of the S&P 500 means equity markets are sending some mixed signals.
The move lower in the S&P 500 this week was accompanied by a good week for the Long Term Treasury Bond ($TLT +2.61%). That type of sentiment usually suggest a risk off type of trade, but the healthy performance in Small Caps ($IWM +1.19%) doesn’t confirm the move. Commodities and Gold continue to get punished by the strong dollar. If you look at the longer term one month and three month performance numbers for the ETF’s below, it doesn’t look like many of the markets are performing exceptionally well. The strong trends we saw in Long Term Treasury Bonds and Real Estate have slowed and a new market hasn’t moved in to outperform. Maybe the Russell will be that market, but it’s too early to know.
Market Stats:
VIX Futures Term Structure:
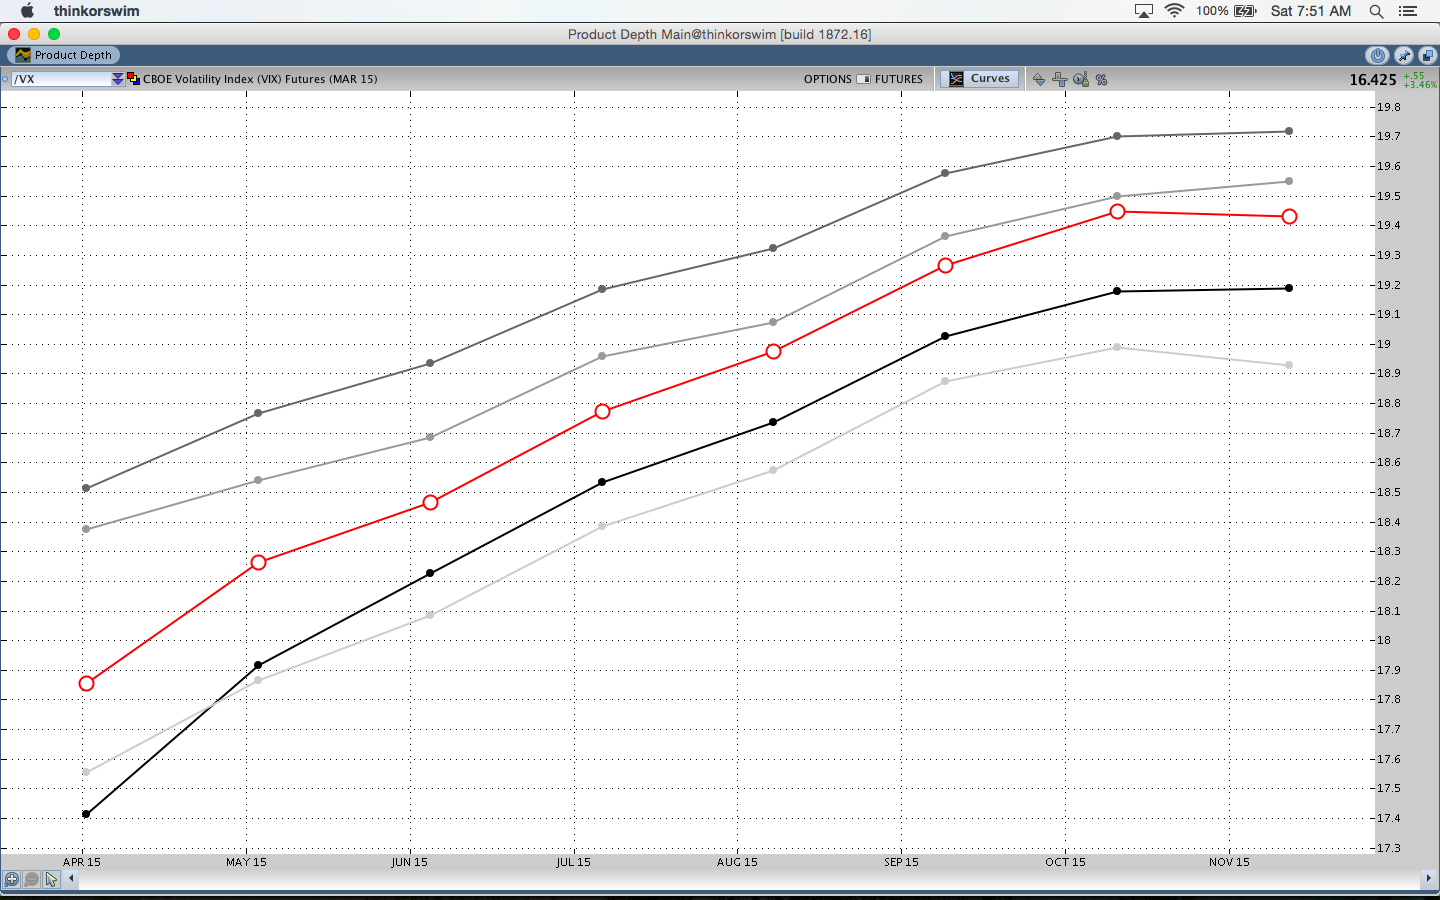
The image below shows a week of the VIX Futures Term Structure. The gray lines become darker on subsequent days of the week and finish with a red line for Friday. The curve moved up sharply with the down move this week and the April to May contract difference grew slightly on Friday. The market seems to have an expectation of higher, rather than lower, volatility.
Implied & Historical Volatility:
Last week I mentioned that I didn’t know what direction the market would go, but that I did expect volatility to increase. 20 day Historical Volatility was below 10% last week and this week it moved higher. The lowest pane in the chart below shows the daily standard deviation move. The Russell has been so quiet that it hasn’t had a 2 standard deviation daily move since early January. That calm has been great for positive Theta trades.
Under the hood . . .
The “Under the Hood” section of the commentary focuses on actual trades that are in the Theta Trend account.
This was a quiet week from a trading standpoint and that’s always good when you’re in a positive Theta trade. The only adjustment I made was rolling down my long $IWM call from 125 to 120 for the $RUT April Butterfly. I made that adjustment to give myself some additional protection in case $RUT decides to move higher and test the 1250 level.
I try to tweet out my trades whenever possible so you should click here and follow me on Twitter.
$RUT April 2015 Options Put Butterfly:
The April $RUT Butterfly was down a little bit of money on the week after being up around mid week. I rolled down the 125 IWM call to 120 and that flattened out my T+Zero line. This week is March options expiration and the trade has about a month to go. The Greeks look good right now and there isn’t anything to do other than wait. I’ll add another Butterfly to the position if $RUT moves up to test 1250.
$SPY March Quarterly Butterfly:
The $SPY Butterfly was closed this week for slightly over a $100 gain. While that doesn’t sound like much, the percentage return is actually fairly high and represents a good gain in my tiny $1,200 IRA account. I’ll get some trade details out sometime soon and we’re going to start talking about a Butterfly strategy for small accounts.
$IWM April Butterfly:
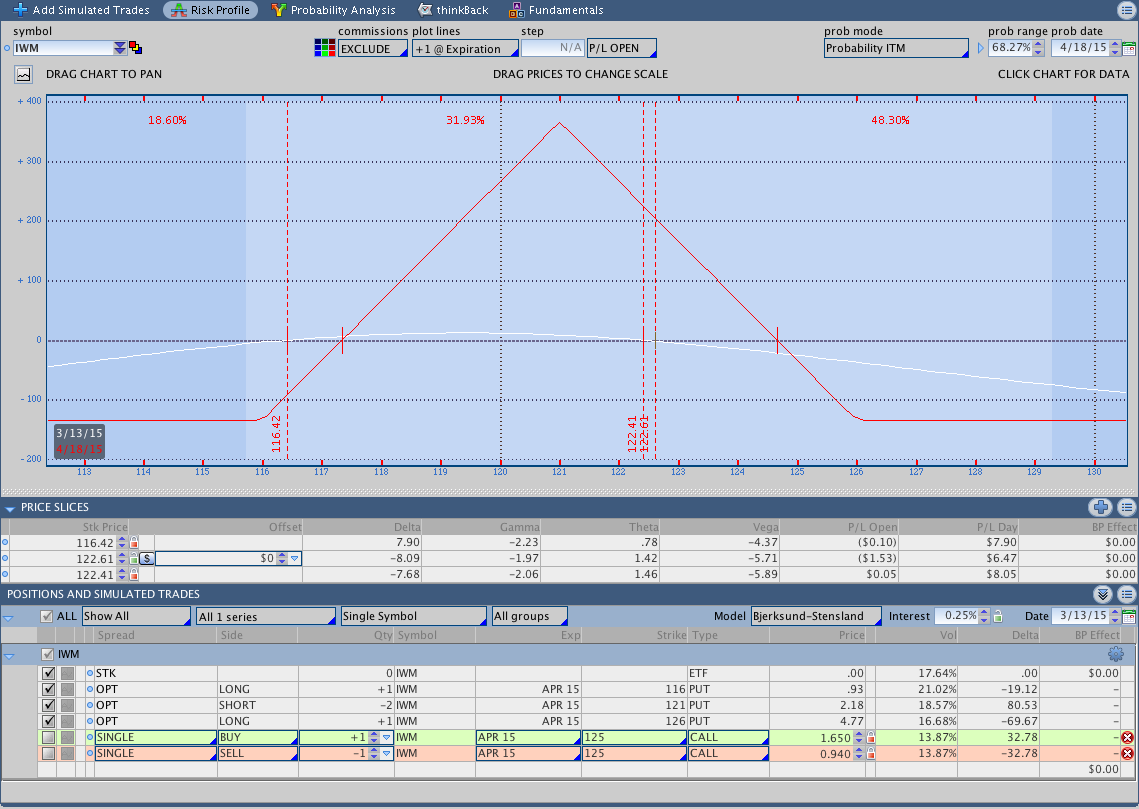
I entered a short dated $IWM Butterfly on Thursday during the move higher. The $IWM trade will be traded similarly to the $SPY trade from last week and is in my small IRA account. The trade is down a little over a dollar and an image of the position is shown below.
Trades This Week:
SPY – Closed the March Quarterly Butterfly. A trade recap will be posted sometime this week.
IWM – Sold to close April 2015 125 Call for .94 – Bought for a 1.65 debit (April Butterfly Hedge)
IWM – Bought to open April 2015 120 Call for 3.46 (April Butterfly Hedge)
IWM – Bought to open 116/121/126 April Put Butterfly for a 1.34 debit
ETF, Options, & Forex Inventory:
SCHA – Long 57 Shares from 57.179
RWO – Long 92 Shares from 48.49
RWO – Long 5 Shares from 50.92
TLO – Long 63 Shares from 78.94
RUT – April 2015 1160/1210/1260 Put Butterfly bought for a 10.40 debit
IWM – April 2015 120 Call bought for a 3.46 debit (April Butterfly Hedge)
IWM – April 2015 116/121/126 Put Butterfly Bought for a 1.34 debit
Looking ahead, etc.:
We saw an increase in realized volatility this week and that’s coming with some mixed signals in the equity markets. Despite the strength in the Russell, the S&P 500 went into the weekend below it’s 50 day moving average. We’ll need to see a little upside confirmation from SPX if the move higher in RUT is going to be successful. This week is March options expiration and I’m out of the March positions with some good gains. The trouble free, April positions are doing fine and it’s about a week before I’ll start looking for May trades. Until then, it’s time wait.
Have a good weekend and thanks for reading.
Please share this post if you enjoyed it.
Click here to follow me on Twitter.
Want to receive an alert as soon as the next market commentary is posted?
Sign up for my email list and stay up to date with the latest information on options trading and trend following.
Click here to sign up for the list, get a copy of the Theta Trend Options Trading System, the Trade Tacker I use, and information about new systems.
Even better . . . it’s all totally free.
