Weekend Market Commentary 1/29/2016 – $RUT, $RVX, $SPX, $VIX, $VXV
Quick Note:
Earlier this week I guest posted on New Trader U, a site run by Steve Burns. Steve does a great job of simplifying concepts and emphasizing principles that matter in trading (like money management). Click here to read the post and check out his site.
Big Picture:
Move along everyone, there’s nothing to see here . . .
 As someone who follows the markets constantly, it’s interesting to see how the Twitter stream, blog comments, and website traffic react to down moves. When the market is moving steadily lower, things seem to quiet down. It’s as though the Ostrich Effect comes into full force and people don’t want to look at or think about the markets. As the markets slowed on the downside and found some stability this week, it seems like the effect softened as people were ready to acknowledge the damage done and look for opportunities.
Despite a solidly lower start to the year, market participants are calm. Even though the long only crowd is likely under pressure, we haven’t seen much in the way of panic. At the same time, the market environment seems different than the 2009-2015 period. The dip buyers are more cautious and, consequently, the market is pulling back more. From the deeper pullbacks we’re not seeing the same sharp reversals that we previously learned to expect. The change suggests that sentiment has shifted. Sharp reversals indicate that buyers don’t want to miss the next move higher and conviction in higher prices ahead. That conviction is questionable at best right now.
Going forward, it’s important to recognize that significant complacency can be the catalyst for significant change. The stock market generally has a buy side pressure, but it does go through periods of sharp decline. It also, however, goes through periods of grinding decline. The real take away is that we never know what environment we’ll receive until after the fact. At the same time, we need to recognize that the market environment over the past few years seems to have changed. Being blindly long may or may not be the best strategy going forward.
As premium sellers, we need to be aware of the potential for risk on both sides of the market. More importantly, we need to recognize volatility has the potential to explode if the complacent get caught off guard. It does seem like some sort of bottom has been made on the move lower, but we haven’t seen the capitulation that tends to accompany larger declines. Even though the market went into the weekend strong, we can’t underestimate the potential for change.
Volatility:
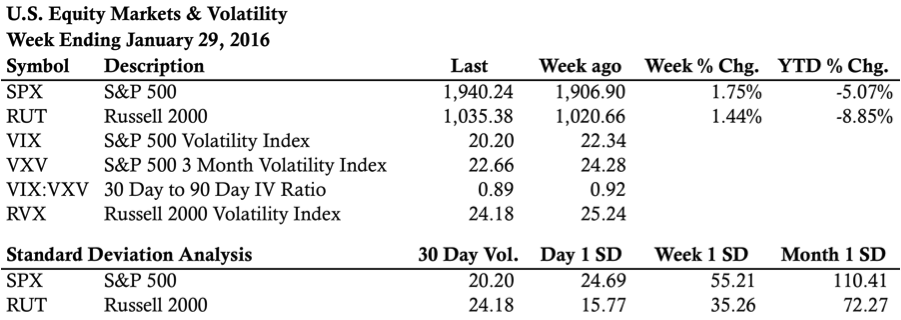
In every weekend commentary this year, we’ve discussed a divergence in volatility. What we’ve said is that despite the move lower in the market, volatility hasn’t panicked. The VIX:VXV ratio we use to confirm panic situations in the market was sluggish at best.
Note: Keep in mind that in true panic environments, the implied volatility of shorter dated options tends to rise more quickly and in excess of longer dated options. As a result, the VIX:VXV ratio that measures 30 day to 3 month implied volatility tends to increase above 1.00 when the market collapses lower.
On Friday, we saw implied volatility collapse at the close and the VIX almost went into the weekend below 20. All measures of volatility are suggesting a significant amount of complacency and, at least for now, volatility has been correct. The images below show Implied Volatility relative to 20 day Historical Volatility. When IV falls below 20 day HV, it tends to correspond with stability and/or a move higher in the market. We’re not being predictive here, but the options market isn’t overly concerned about the bearish start to 2016.
All that being said, we need to put volatility in context. The market has been steadily sold this January and volatility has remained under control. That does not necessarily mean that the market will head higher. There are different types of bear markets and a grinding bear market where volatility remains largely under control is possible.
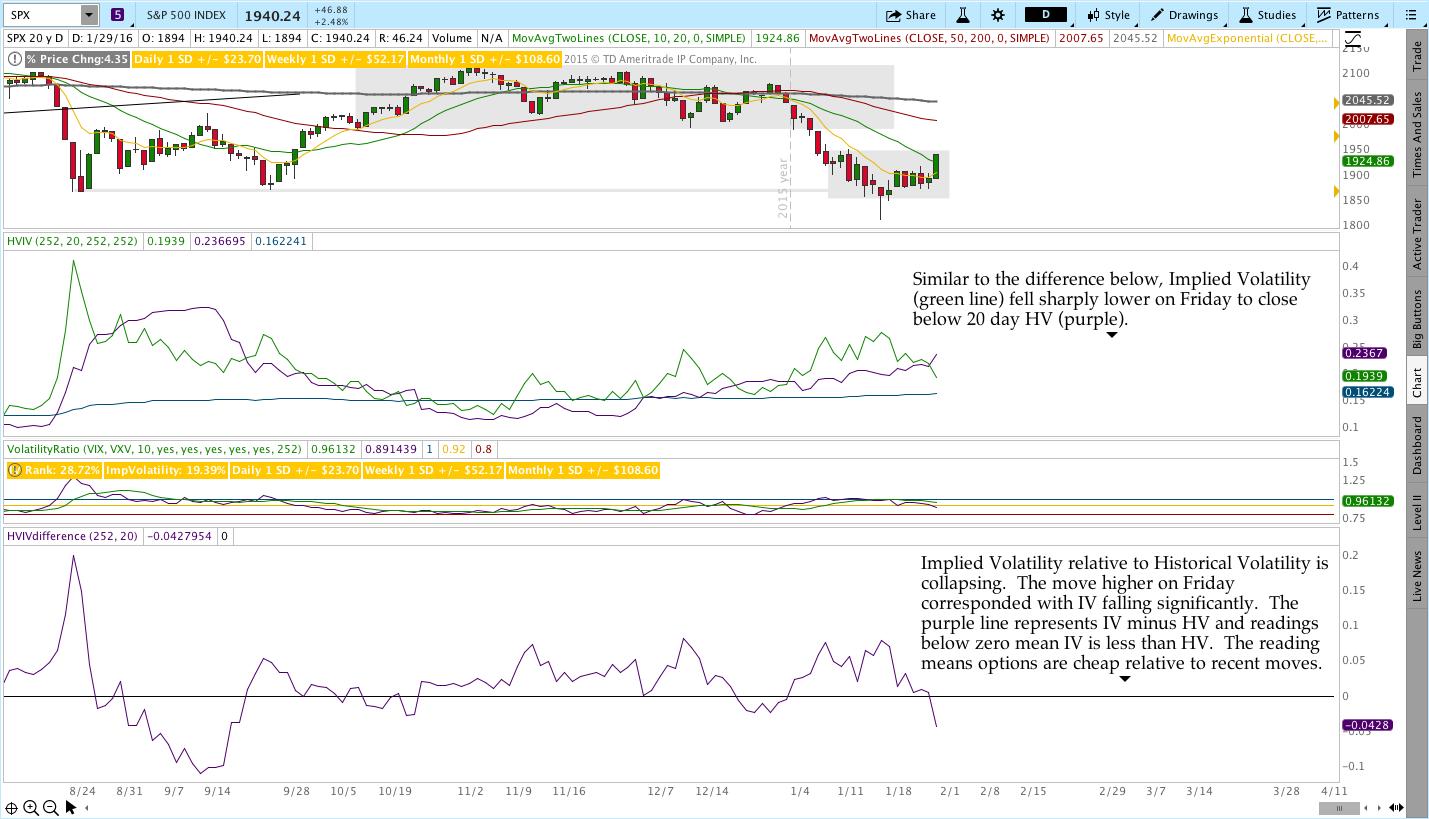
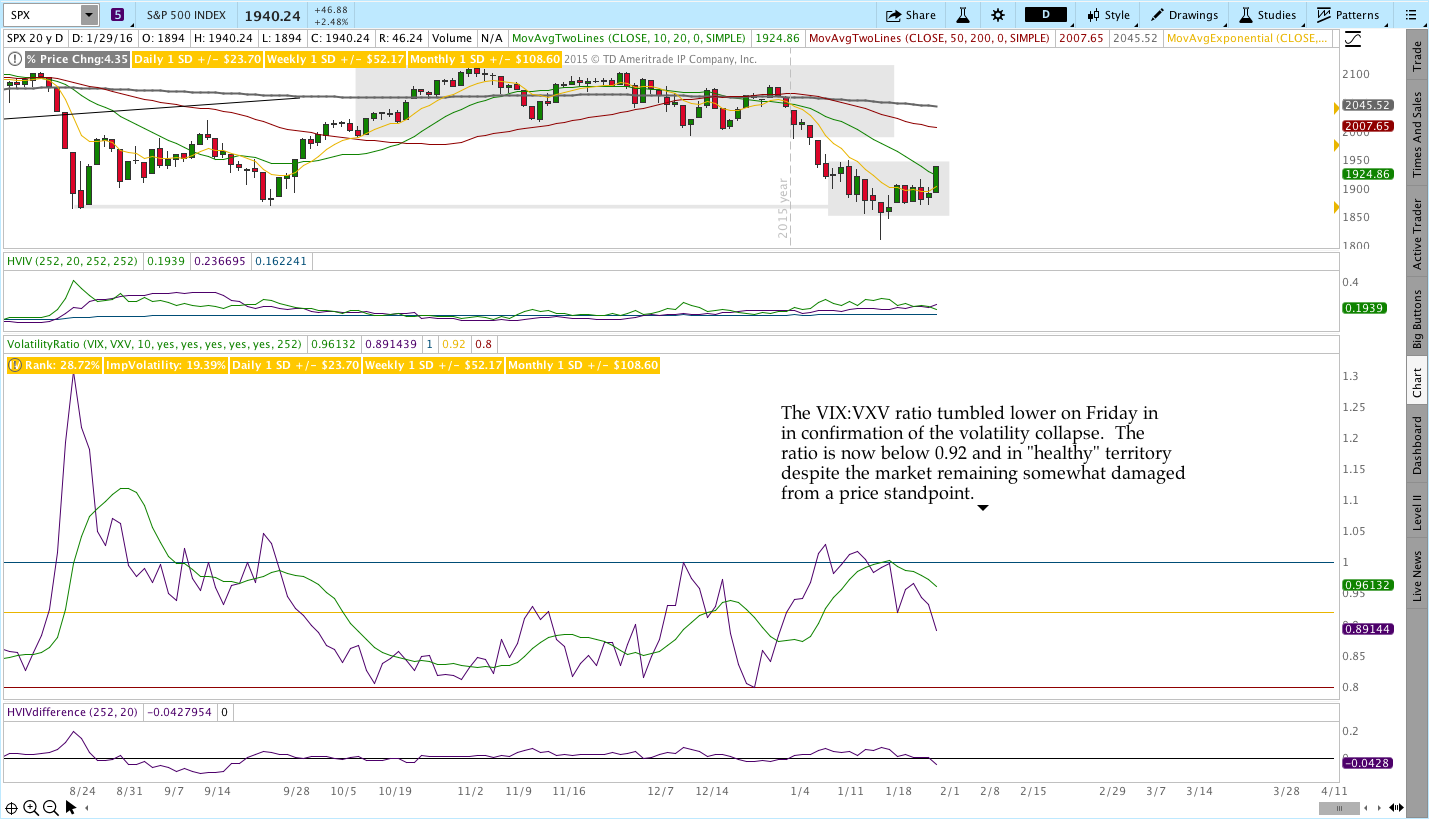
The term structure of VIX futures has also flattened out and is trading above spot VIX. The curve isn’t quite back to healthy contango, but it’s trying.

Market Stats:
Levels of Interest:
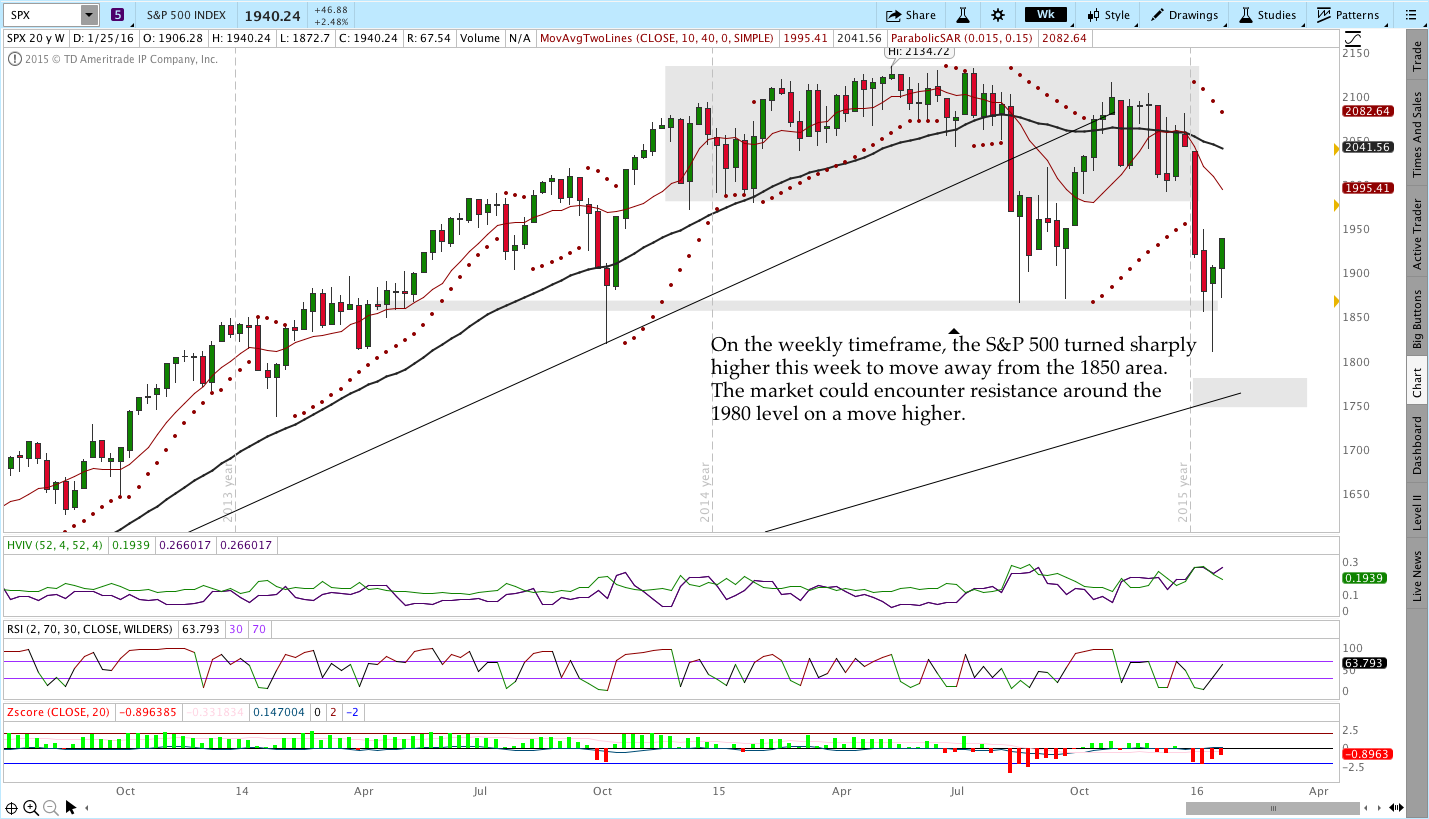
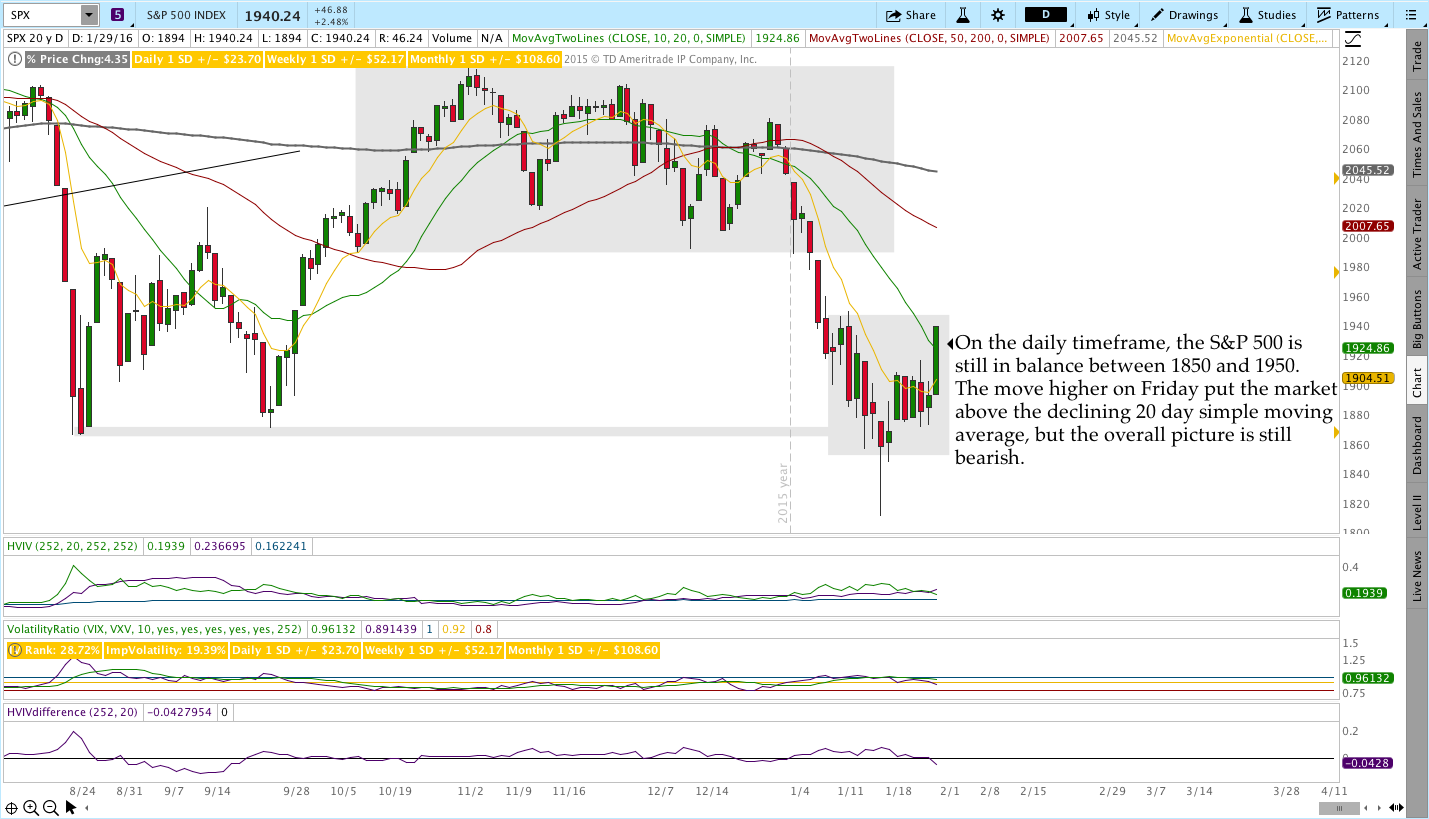
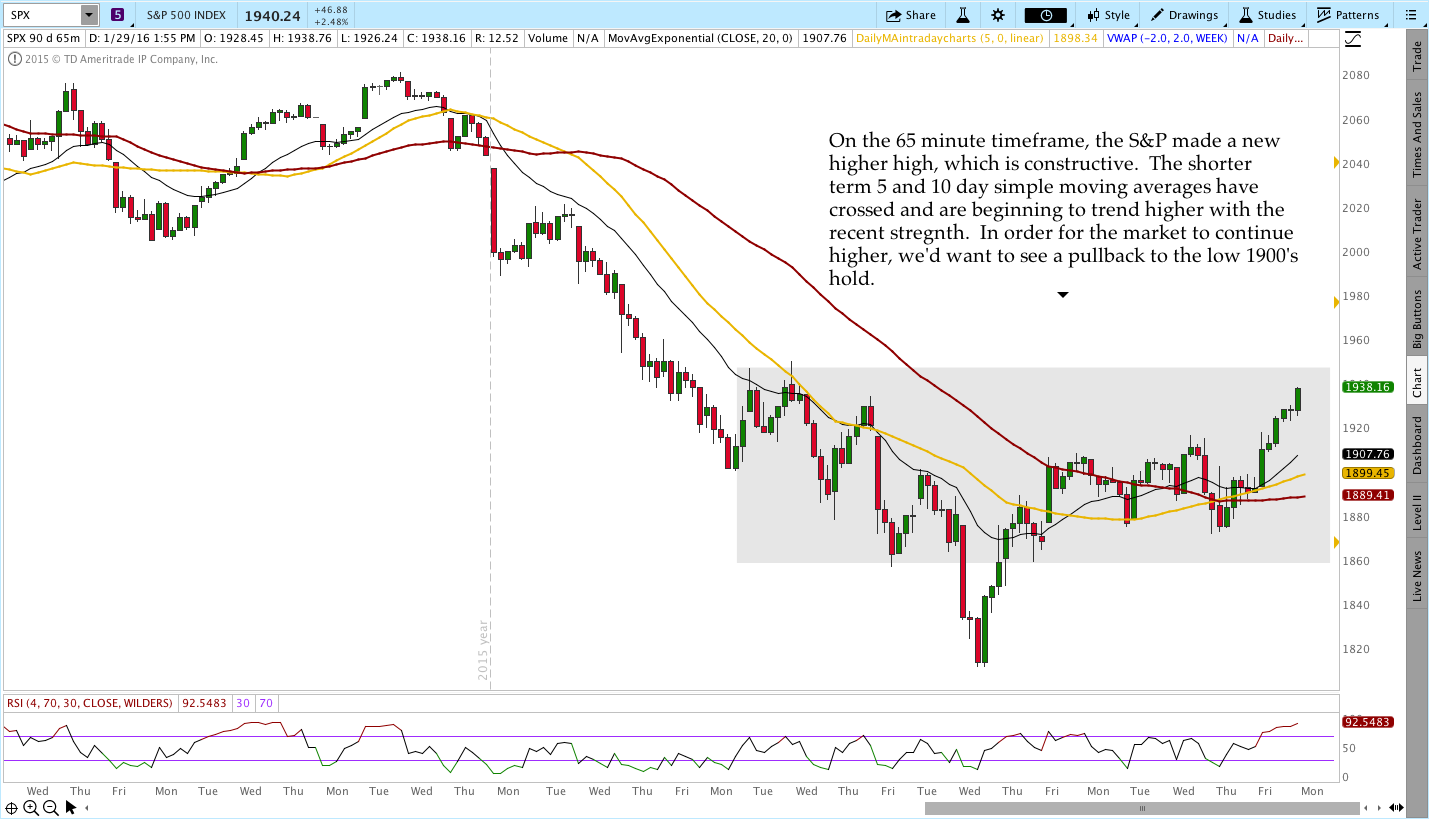
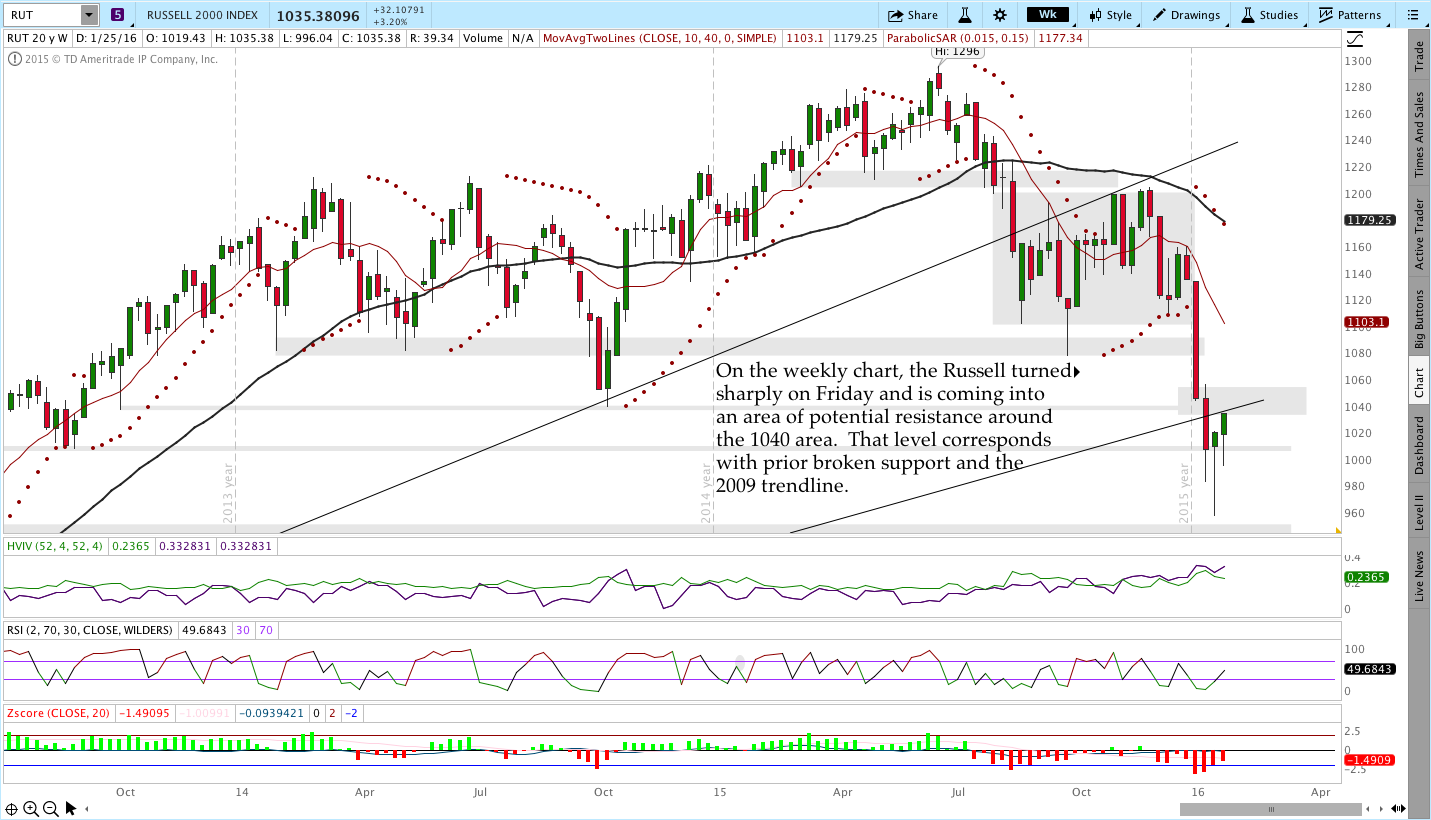
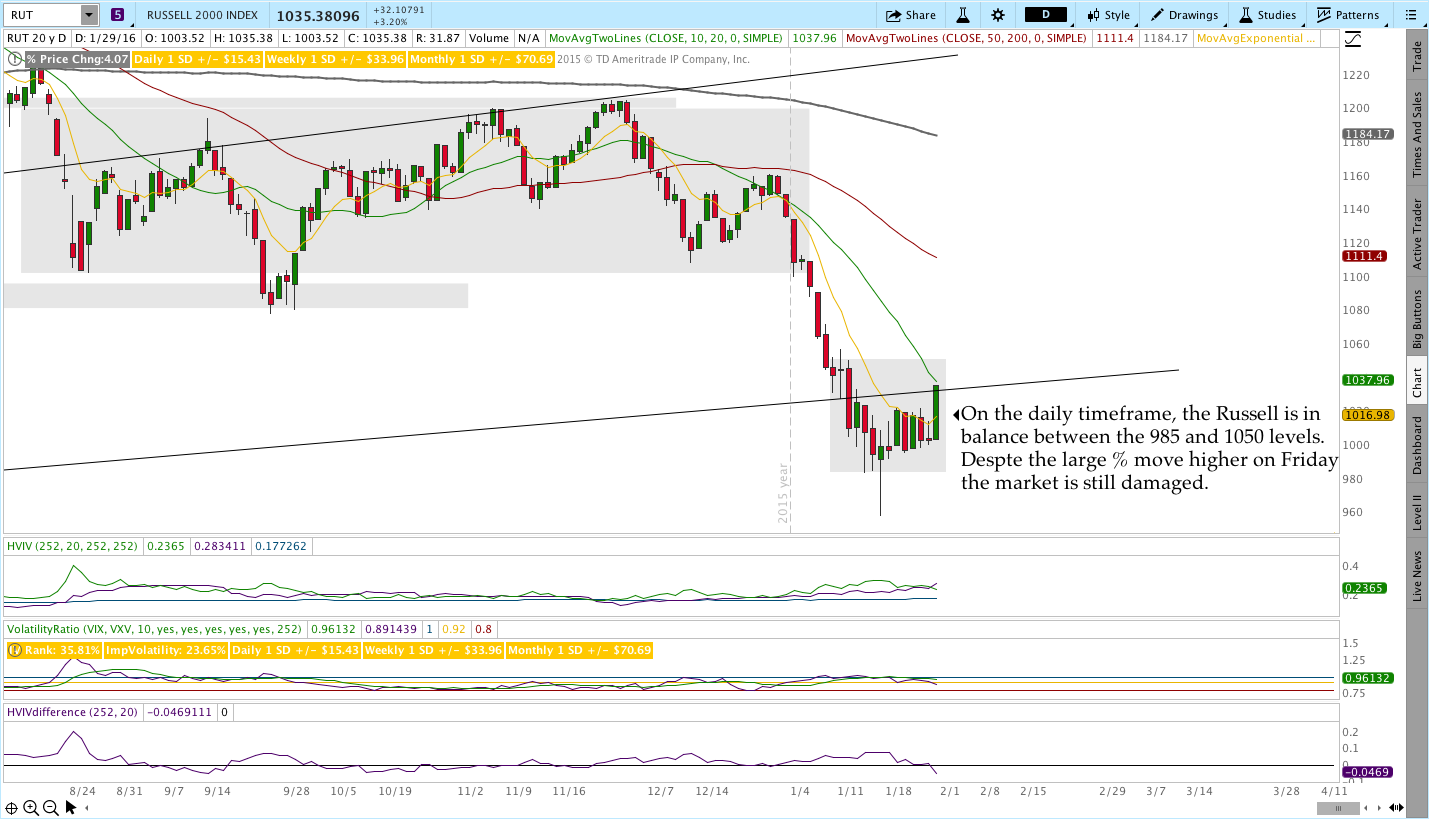
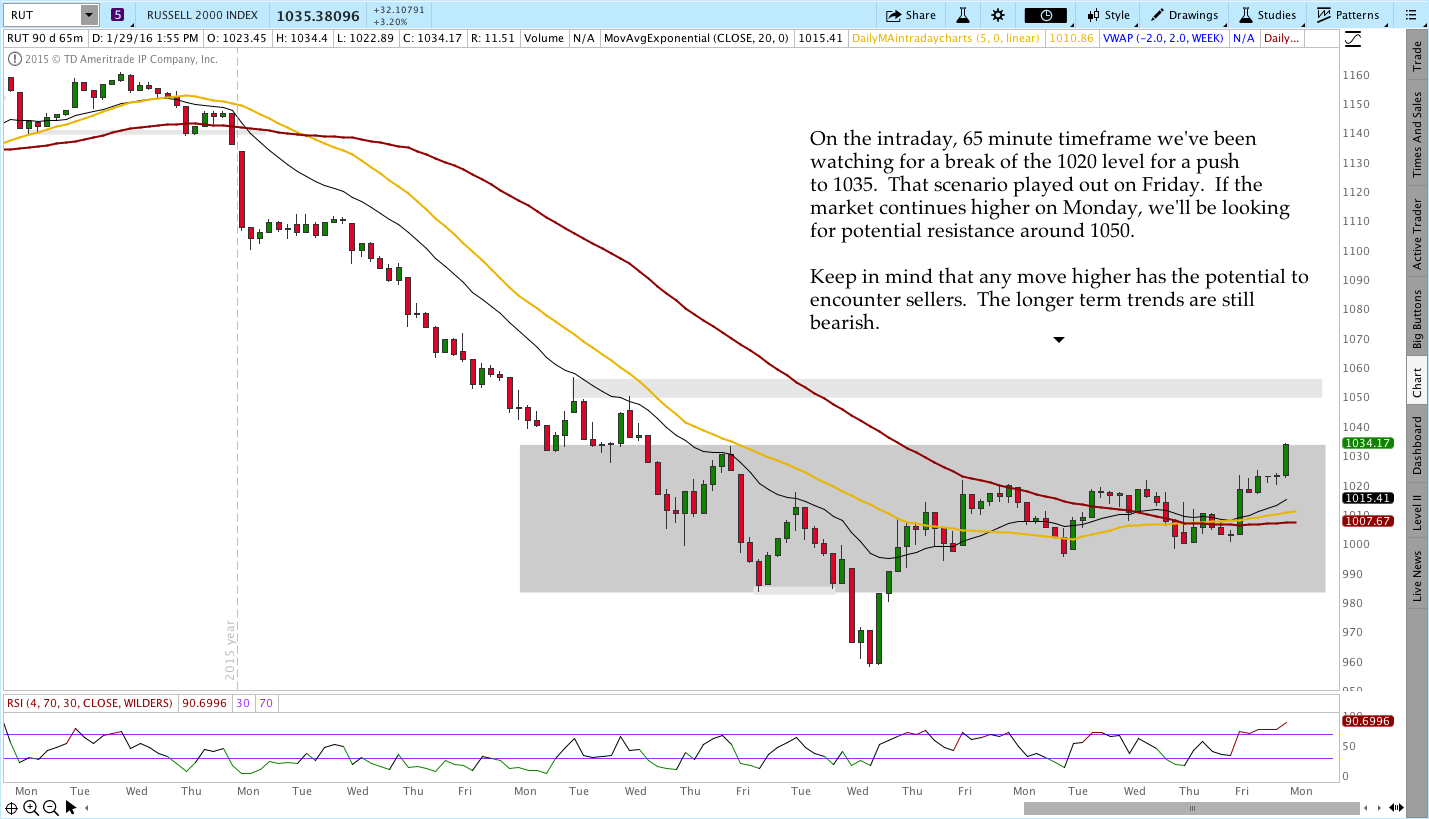
In the levels of interest section, we’re drilling down through some timeframes to see what’s happening in the markets. The analysis begins on a weekly chart, moves to a daily chart, and finishes with the intraday, 65 minute chart of the S&P 500 (SPX) and the Russell 2000 ($RUT). Multiple timeframes from a high level create context for what’s happening in the market.
S&P 500 – $SPX (Weekly, Daily, and 65 Minute Charts):
Russell 2000 – $RUT (Weekly, Daily, and 65 Minute Charts):
Live Trades . . .
The “Live Trades” section of the commentary focuses on actual trades that are in the Theta Trend account. The positions are provided for educational purposes only.
——————————
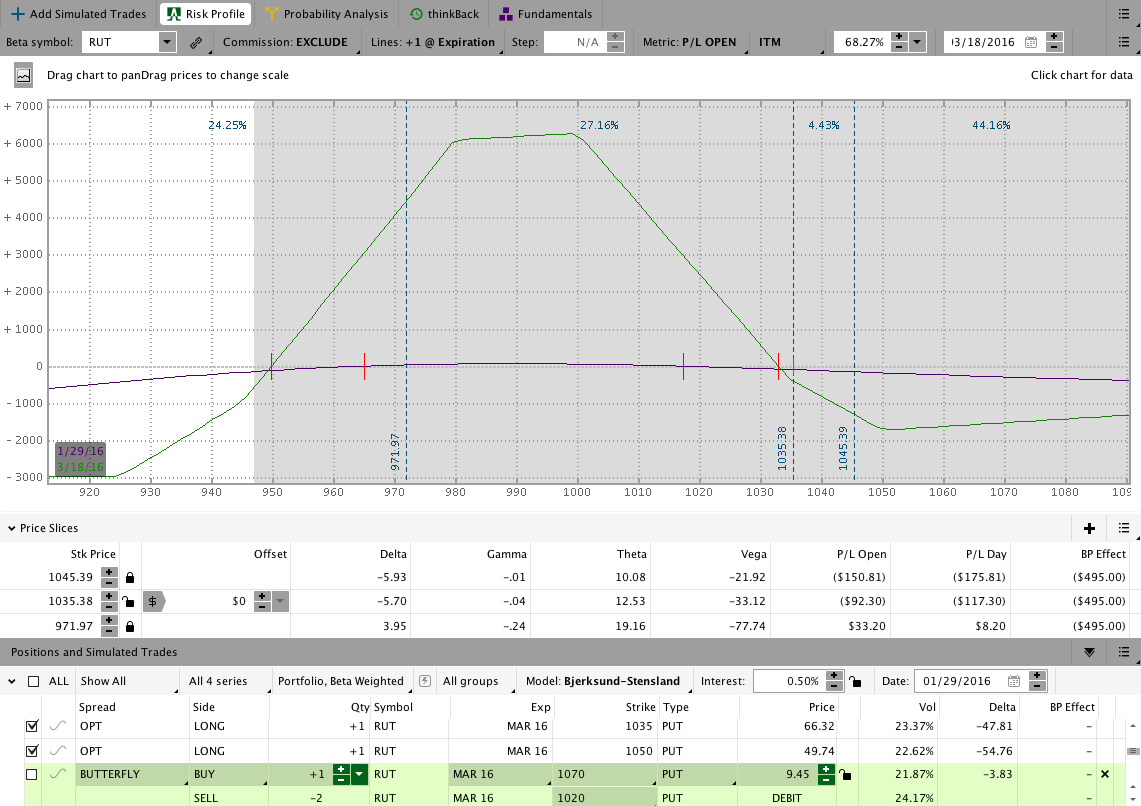
The March 2016 CIB trade is open and chugging along. I’ve been updating the Live Trade Page every day and I encourage you to check out that page if you’d like to learn more about trade entry, adjustments, and how I evaluate the market.
The market closed outside the body of the Butterfly on Friday with the strong rally that took place in the last hour of trading. If that level holds on Monday morning, we’ll need to adjust the trade on the upside again. If the market pulls back, an adjustment won’t be necessary.
Check out the Results Tab for fill prices and order specifics.
If you want to learn a safer, less painful way to trade options for income, check out the Core Income Butterfly Trading Course.
March 2016 Core Income Butterfly Trade:
The Results Spreadsheet is up to date as of Friday. All of the trades mentioned there are actual trades that I’ve taken. There are no paper trades or fuzzy fills, they’re all real.
Looking ahead, etc.:
Even though the market raced higher on Friday, we’re still in good shape. I was able to close a few Broken Wing Butterflies this week to book some January profits and the open trades are all under control. The move higher is something we’ve been anticipating and, frankly, it’s not that surprising. We’ll see what happens next week and if the market can hold the move.
Have a great weekend and please share this post if you enjoyed it.
Click here to follow me on Twitter.
Want to receive an alert as soon as the next market commentary is posted?
Sign up for my email list and stay up to date with the latest information on options trading.
Click here to sign up for the list, get a copy of the Theta Trend Options Trading System, the Trade Tacker I use, and information about new systems.
Even better . . . it’s all totally free.
