Weekend Market Commentary 10/23/15 – $RUT, $RVX
Big Picture:
 Despite the noble path of being a Bear, it can be a little frustrating at times. The strange reality of the US Stock markets is that historically the markets have gone higher given a long enough period of time. I’ve talked about it before, but there is a natural buy side pressure in the stock market because people want to “invest” in stocks. Another way of looking at the phenomenon is that most of the marginal money is long, not short. In other words, most of the money that comes into the market wants to buy, not sell. We’ve also seen rising nominal prices of assets over time (think inflation).
Over some windows of time, the marginal sentiment changes and prices go lower as participants choose to sell their investments. One of the structural challenges Bear markets face is that people view the markets with a retail mentality. When prices go down, they want to buy. We generally don’t know who is buying the dips, but someone definitely bought the last one. Sometimes that works and sometimes it doesn’t.
The world is full of people who want to tell you what direction the market will go and why. Some of those people use Fundamental Analysis and others use Technical Analysis. By default, all of that information and analysis is based on historical data. Clearly we can’t analyze future information. We’re trying to make sense of the future based on the past and people tend to place heavy emphasis on what has happened recently. As a result, there are a large number of predictions that look very similar to whatever just happened in the market.
The sell off in late August suggested a potential shift in the market. We saw price fall and average prices declined. Many people got scared and thought the market had the potential to go lower. That bias or market opinion was based on what had just happened and for long only, long always investors it was a painful experience. Price has rebounded significantly over the past couple of weeks and the sentiment is undergoing another shift because the most recent information seems Bullish. That pattern can continue, stagnate, or reverse.
Whether or not someone predicts market direction correctly or not is irrelevant. Since market can go up, down, or stay the same, everyone has at least a 33% chance of being right. 33% is a pretty good chance and we’re bound to see some people get it right. If you consider the artificial buy side pressure in stocks, the probabilities are probably skewed to the long side. Most of the media cheerleaders promote the long side anyway and, sadly, they’re still irrelevant.
The trend is confusing right now (if one even exists) so it’s extremely important to remain fluid in our opinions and react to changes as they play out. Any time we think the market doesn’t make sense it’s because we’re projecting our opinions on the market and it isn’t doing what we think it should do. It’s much easier to change our opinions than the market.
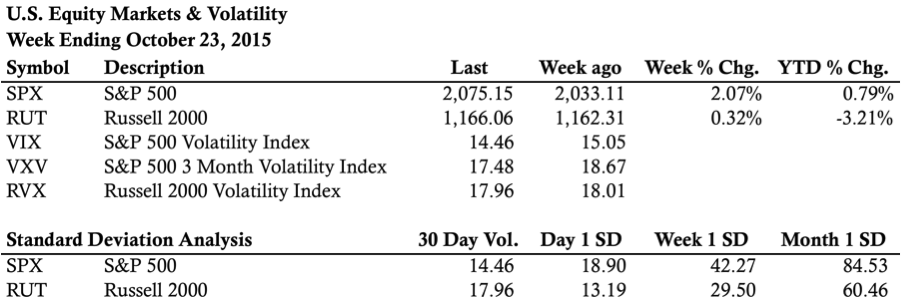
In the short term, most of the major Equity markets are overbought. That overbought condition can resolve itself either through price or consolidation (time). Alternatively, the move higher could be setting up a nice Bull trap. Surely we can dream, right? Next week I’ll be reacting to changes as they play out. The Russell 2000 has been sitting relatively unchanged for a couple of weeks now. One thing we know with certainty is that, at some point, that will change.
Market Stats:
Levels of Interest:
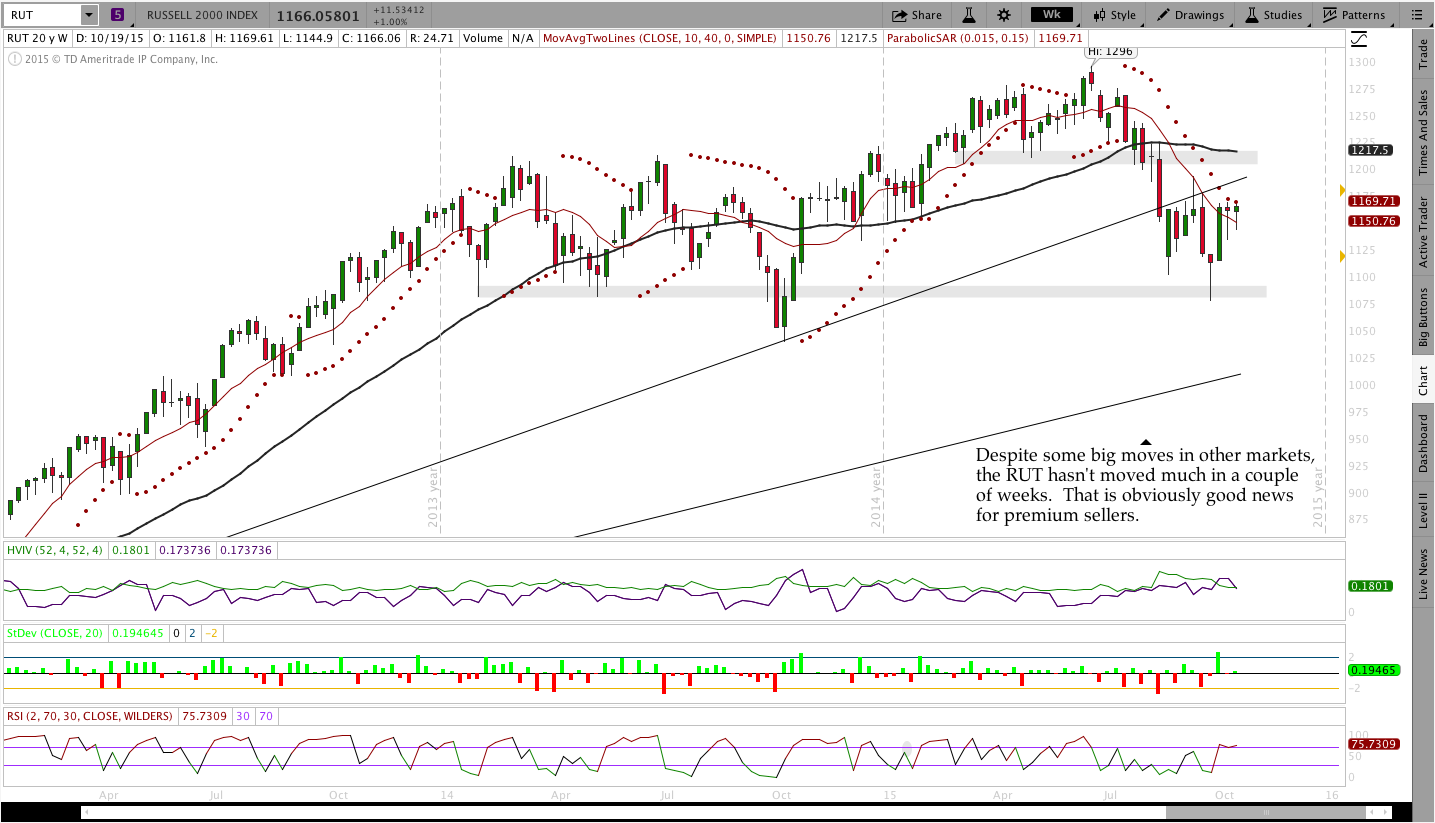
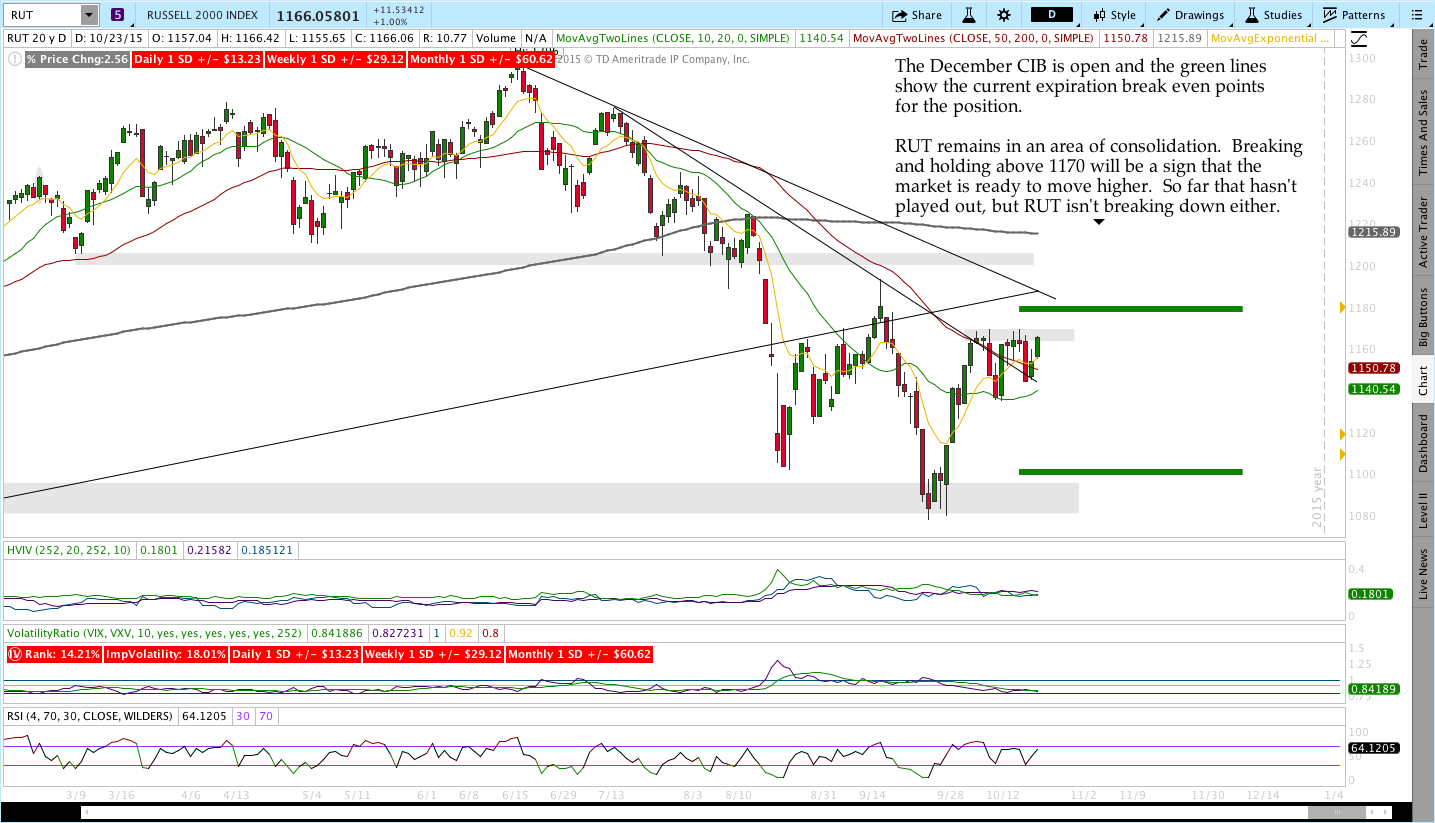
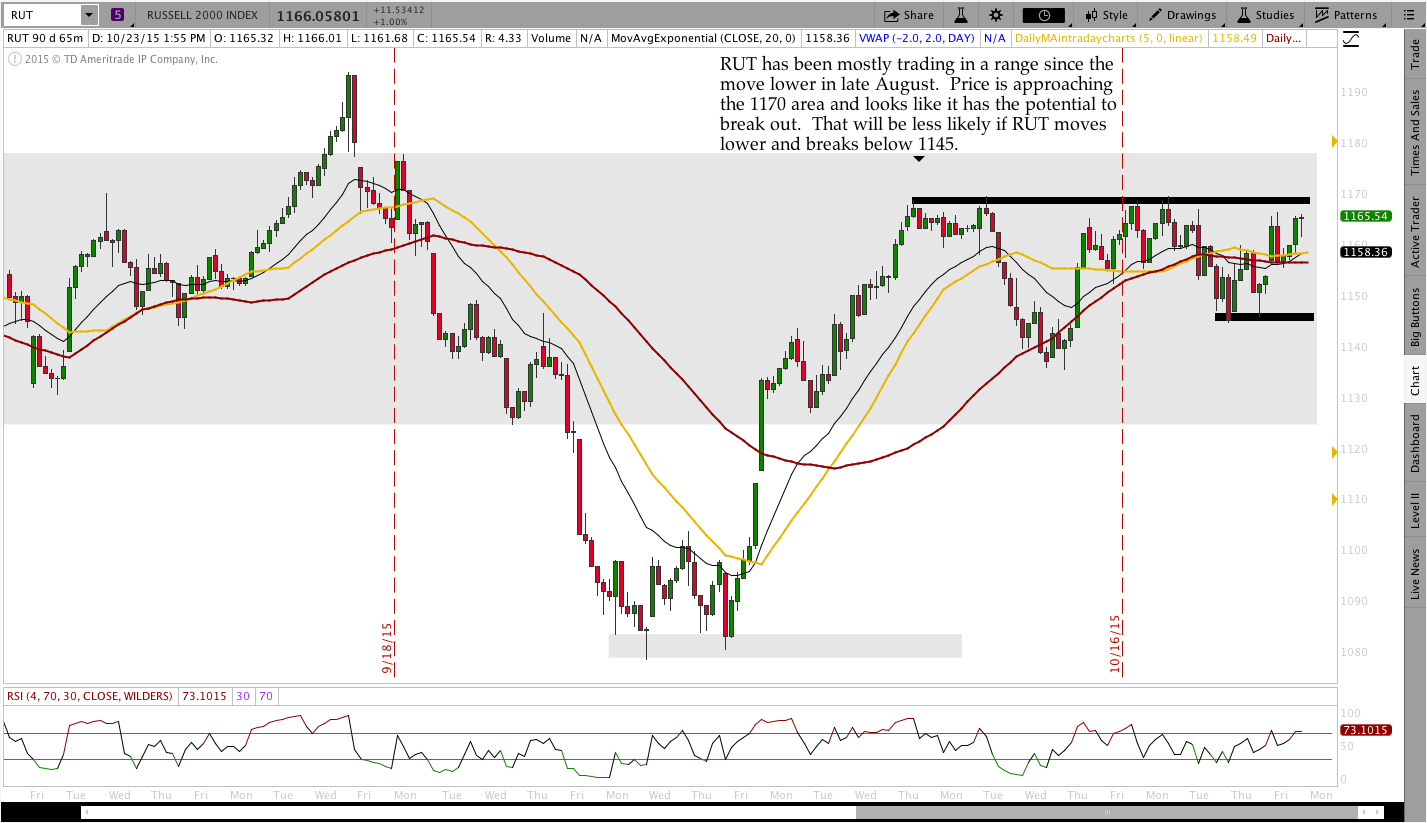
In the levels of interest section, we’re drilling down through some timeframes to see what’s happening in the markets. The analysis begins on a weekly chart, moves to a daily chart, and finishes with the intraday, 65 minute chart of the Russell 2000 ($RUT). Multiple timeframes from a high level create context for what’s happening in the market.
Live Trades . . .
The “Live Trades” section of the commentary focuses on actual trades that are in the Theta Trend account. The positions are provided for educational purposes only.
—————————–
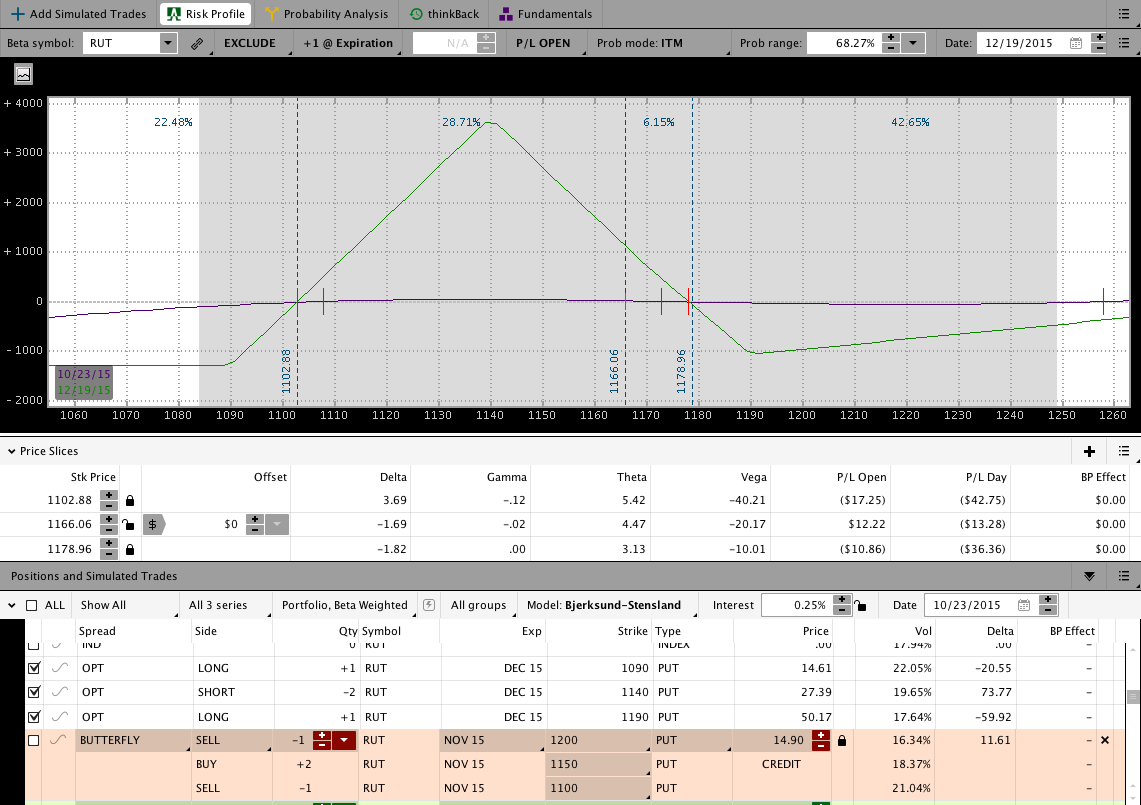
I opened the December CIB this week and the trade is sitting around doing fine for now. On the upside, the first adjustment point is around 1180-1185. Hitting the adjustment level is very possible if RUT breaks above the 1170 level that has been acting as resistance.
Click here to learn about the Premium Course that covers the CIB Trade in Detail
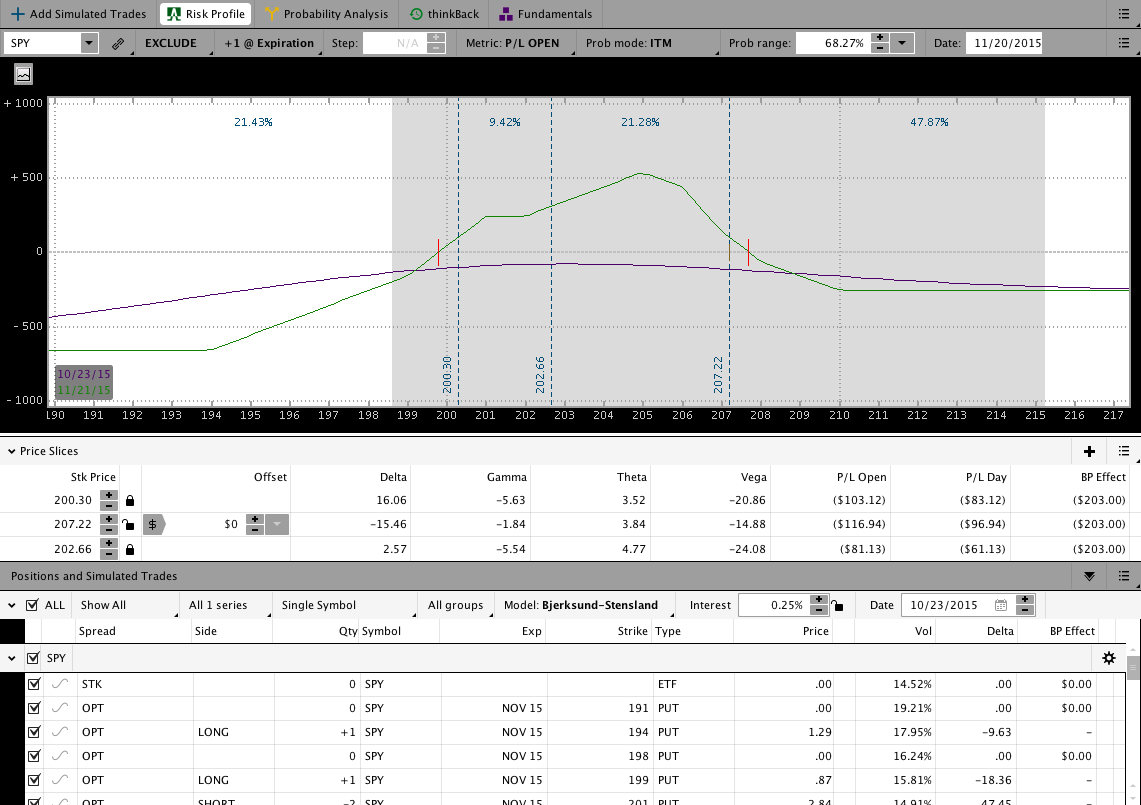
An updated image of the November Migrating Butterly is shown below. I have been chasing the market higher since this trade was entered. The trade has been challenged significantly this month with the big move higher in SPY. If we don’t see a pullback in SPY this coming week, I am likely to shut this trade down and take the loss.
One of the problems with the Migrating Butterfly vs. the CIB is that the MB locks in losses if the market moves higher. The CIB generally doesn’t get drawn down because the long call protects the position on the upside.
Looking ahead, etc.:
The 1170 level in RUT will be my main area of focus and concern next week. If the market can get above that area, we’re likely to see a move higher. I’d rather see the market break down, but I have no control over that.
Even though the other major markets seem very overbought, it doesn’t mean they will decline in price. Over time price tends to revert to the mean, but that can happen through either a decline in price or a rising mean. The recent price action makes a case for the rising mean scenario. We’ll need to wait and see what happens.
Have a great weekend.
Please share this post if you enjoyed it.
Click here to follow me on Twitter.
Want to receive an alert as soon as the next market commentary is posted?
Sign up for my email list and stay up to date with the latest information on options trading.
Click here to sign up for the list, get a copy of the Theta Trend Options Trading System, the Trade Tacker I use, and information about new systems.
Even better . . . it’s all totally free.
